Visualizing EXFOR Cross Sections
In this notebook, several EXFOR cross sections will be plotted to demonstrate some of NucML’s visualization capabilities.
[3]:
# # Prototype
# import sys
# sys.path.append("../..")
[4]:
# importing necessary modules
import seaborn as sns

import nucml.exfor.data_utilities as exfor_utils
import nucml.evaluation.data_utilities as eval_utils
import nucml.datasets as nuc_data
import nucml.evaluation.plot as eval_plot
[5]:
# sns.set(font_scale=1.3)
sns.set(font_scale=2.5)
sns.set_style("white")
[6]:
# Setting up the path where our figures will be stored
figure_dir = "./Figures/"
Plotting Cross Sections (EXFOR + ENDF)
Before being able to plot any data, we first need to load the EXFOR data. In this tutorial, we will only plot neutron-induce reaction cross section data. Let us load the data points using NucML.
[7]:
df = nuc_data.load_exfor()
INFO:root: MODE: neutrons
INFO:root: LOW ENERGY: False
INFO:root: LOG: False
INFO:root: BASIC: -1
INFO:root:Reading data from C:/Users/Pedro/Desktop/ML_Nuclear_Data/EXFOR/CSV_Files\EXFOR_neutrons/EXFOR_neutrons_MF3_AME_no_RawNaN.csv
INFO:root:Data read into dataframe with shape: (4255409, 104)
INFO:root:Finished. Resulting dataset has shape (4255409, 104)
[10]:
# a bug exists since dtypes are not specified, current fix is to transform the MT feature into int type
df.MT = df.MT.astype(int)
The plotting utilities will make use of the loaded data. If you want to plot proton induce reactions, you need to load that type of data before proceeding. The plotting utilities contain various functionalities and arguments to help you get presentation-ready figures fast. However, you can always just filter the data and use any visualization packages and styles you want. These are merely utility functions provided to you. For information on the argument meanings please visit the documentation: https://pedrojrv.github.io/nucml/nucml.exfor.html#module-nucml.exfor.data_utilities
[12]:
kwargs = {"nat_iso":"I", "one_hot":False, "alpha":0.7, "legend":True, "interpolate":False,
          "log_plot":True, "ref":True}

cl_exfor_endf = exfor_utils.plot_exfor_w_references(df, 17, 35, 102,
                                                    get_endf=True,
                                                    error=True,
                                                    save=True,
                                                    path=figure_dir,
                                                    **kwargs)
INFO:root:EVALUATION: Extracting data from C:/Users/Pedro/Desktop/ML_Nuclear_Data/Evaluated_Data\neutrons/Cl035/endfb8.0/tables/xs/n-Cl035-MT102.endfb8.0
INFO:root:EVALUATION: Converting MeV to eV...
INFO:root:EVALUATION: Converting mb to b...
INFO:root:EVALUATION: Finished. ENDF data contains 28950 datapoints.
INFO:root:Extracting samples from dataframe.
INFO:root:EXFOR extracted DataFrame has shape: (43, 104)
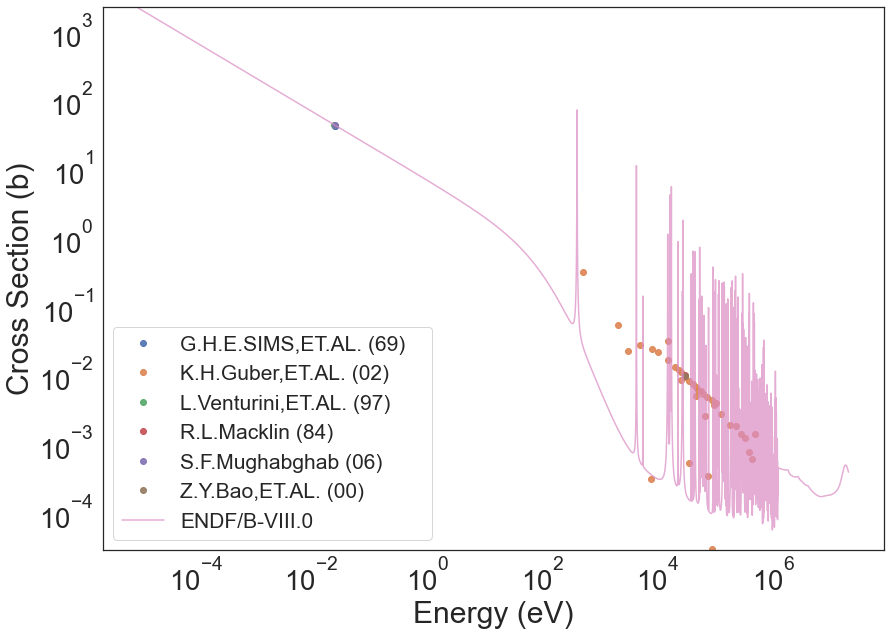
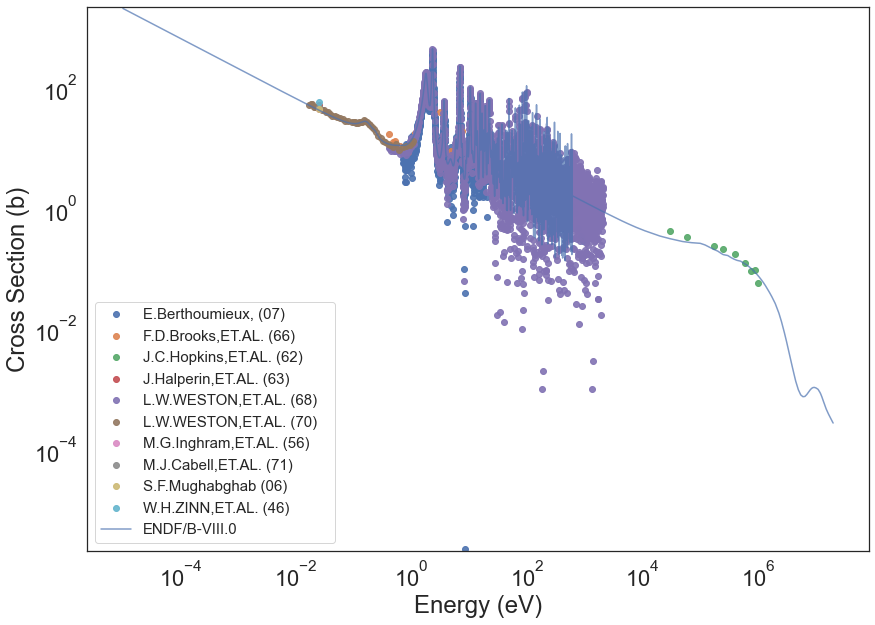
Notice that we created the plot for Chlorine 35 (n,g) and we were able to add the ENDF line by just specifying get_endf=True. The plot_exfor_w_reference() returns a DataFrame and it can be used to create new personal plots using raw data extracted. We can do the same for other reactions including Cl-35(n,tot), Fe-56(n,g), and Fe-56(n,tot).
[14]:
kwargs = {"nat_iso":"I", "one_hot":False, "alpha":0.7, "legend":True, "interpolate":False,
          "log_plot":True, "ref":True}

cl_exfor_endf = exfor_utils.plot_exfor_w_references(df, 17, 35, "1",
                                                    get_endf=True,
                                                    error=True,
                                                    save=True,
                                                    path=figure_dir,
                                                    **kwargs)
INFO:root:EVALUATION: Extracting data from C:/Users/Pedro/Desktop/ML_Nuclear_Data/Evaluated_Data\neutrons/Cl035/endfb8.0/tables/xs/n-Cl035-MT001.endfb8.0
INFO:root:EVALUATION: Converting MeV to eV...
INFO:root:EVALUATION: Converting mb to b...
INFO:root:EVALUATION: Finished. ENDF data contains 12359 datapoints.
INFO:root:Extracting samples from dataframe.
INFO:root:EXFOR extracted DataFrame has shape: (128, 104)
[15]:
kwargs = {"nat_iso":"I", "one_hot":False, "alpha":0.7, "legend":True, "interpolate":False,
          "log_plot":True, "ref":True}

fe_exfor_endf = exfor_utils.plot_exfor_w_references(df, 26, 56, "102",
                                                    legend_size=17,
                                                    error=True,
                                                    save=True,
                                                    get_endf=True,
                                                    path=figure_dir,
                                                    **kwargs)
INFO:root:EVALUATION: Extracting data from C:/Users/Pedro/Desktop/ML_Nuclear_Data/Evaluated_Data\neutrons/Fe056/endfb8.0/tables/xs/n-Fe056-MT102.endfb8.0
INFO:root:EVALUATION: Converting MeV to eV...
INFO:root:EVALUATION: Converting mb to b...
INFO:root:EVALUATION: Finished. ENDF data contains 45284 datapoints.
INFO:root:Extracting samples from dataframe.
INFO:root:EXFOR extracted DataFrame has shape: (222, 104)
[25]:
kwargs = {"nat_iso":"I", "one_hot":False, "alpha":0.7, "legend":True, "interpolate":False,
          "log_plot":True, "ref":True, "figure_size":(18,10)}

fe_exfor_endf = exfor_utils.plot_exfor_w_references(df, 26, 56, "1",
                                                    legend_size=15,
                                                    error=True,
                                                    save=True,
                                                    get_endf=True,
                                                    path=figure_dir,
                                                    **kwargs)
INFO:root:EVALUATION: Extracting data from C:/Users/Pedro/Desktop/ML_Nuclear_Data/Evaluated_Data\neutrons/Fe056/endfb8.0/tables/xs/n-Fe056-MT001.endfb8.0
INFO:root:EVALUATION: Converting MeV to eV...
INFO:root:EVALUATION: Converting mb to b...
INFO:root:EVALUATION: Finished. ENDF data contains 42005 datapoints.
INFO:root:Extracting samples from dataframe.
INFO:root:EXFOR extracted DataFrame has shape: (22516, 104)
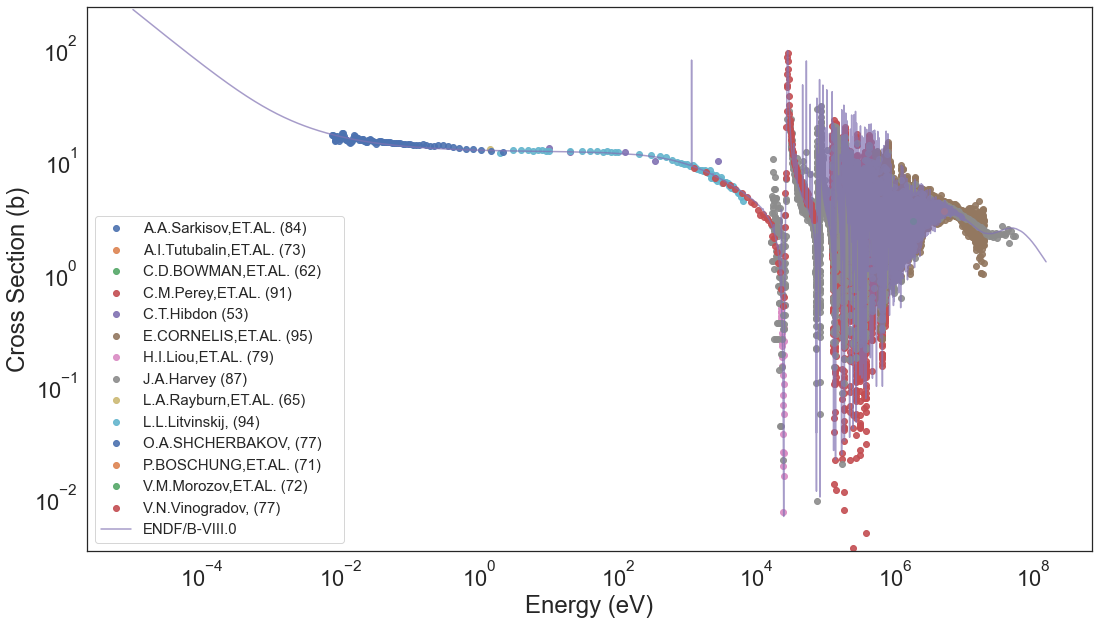
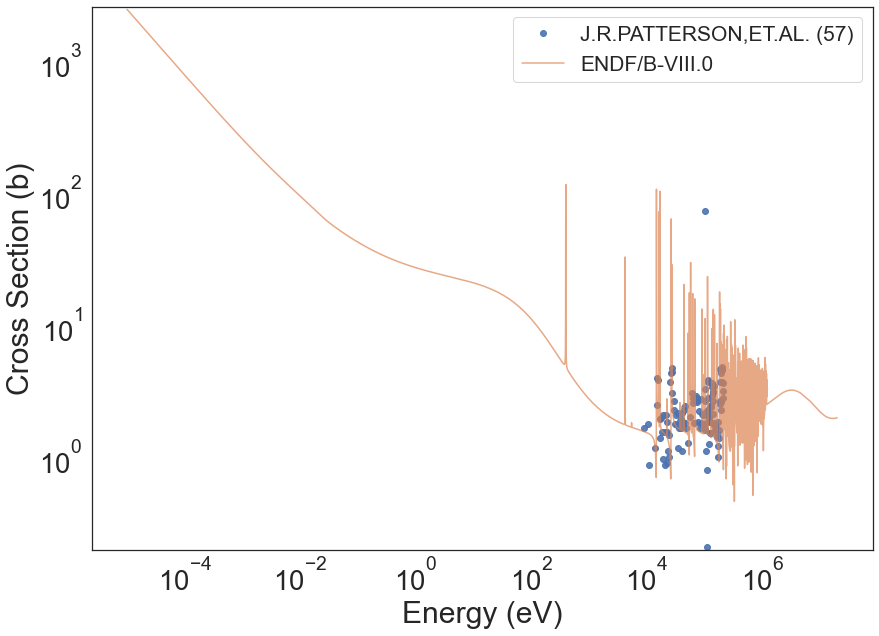
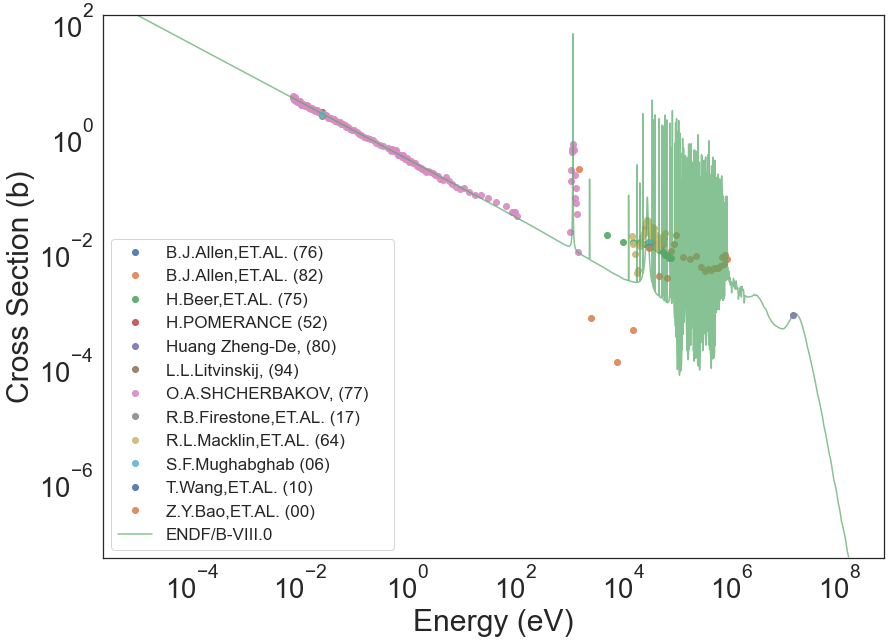
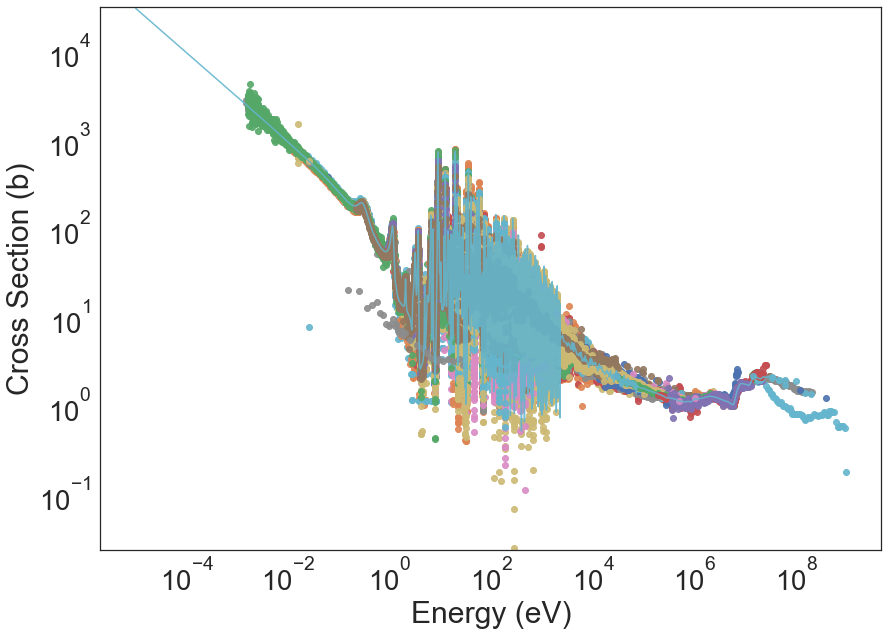
Notice how in the previous cases the data point legends start to decrease in font size. For reaction channels where experimental campaigns are above ~20, plotting with legends becomes unfeasible. We can turn them off while maintaining the coloring by specifying legend=False. For example:
[16]:
kwargs = {"nat_iso":"I", "one_hot":False, "alpha":0.9, "legend":False, "interpolate":False,
          "log_plot":True, "ref":True}

u_exfor_endf = exfor_utils.plot_exfor_w_references(df, 92, 235, 18,
                                                   get_endf=True,
                                                   error=True,
                                                   save=True,
                                                   path=figure_dir,
                                                   **kwargs)
INFO:root:EVALUATION: Extracting data from C:/Users/Pedro/Desktop/ML_Nuclear_Data/Evaluated_Data\neutrons/U235/endfb8.0/tables/xs/n-U235-MT018.endfb8.0
INFO:root:EVALUATION: Converting MeV to eV...
INFO:root:EVALUATION: Converting mb to b...
INFO:root:EVALUATION: Finished. ENDF data contains 46678 datapoints.
INFO:root:Extracting samples from dataframe.
INFO:root:EXFOR extracted DataFrame has shape: (133199, 104)
Plotting EXFOR with Newly Imported Data
There will be some cases were you just measured new data in the lab and is therefore not part of EXFOR. You can make use of NucML’s visualization utilities as long as the new file contains two basic columns: Energy and Data. Let us go through an example where we load external new data points.
[19]:
# Load new data, load chlorine35(n,p) exfor and evaluation
new_data = eval_utils.load_new("../New_Data/cl35_np.csv")
chlorine_35_np = exfor_utils.load_samples(df, 17, 35, "103")
INFO:root:Finish reading ENDF data with shape: (12, 4)
INFO:root:Extracting samples from dataframe.
INFO:root:EXFOR extracted DataFrame has shape: (215, 104)
[20]:
kwargs = {"nat_iso":"I", "one_hot":False, "alpha":0.7, "legend":True, "interpolate":False,
          "log_plot":True, "ref":True, "figure_size":(18,10)}

cl_exfor_endf = exfor_utils.plot_exfor_w_references(df.copy(), 17, 35, "103",
                                                    new_data=new_data,
                                                    get_endf=True,
                                                    error=True,
                                                    save=True,
                                                    path=figure_dir,
                                                    **kwargs)
INFO:root:EVALUATION: Extracting data from C:/Users/Pedro/Desktop/ML_Nuclear_Data/Evaluated_Data\neutrons/Cl035/endfb8.0/tables/xs/n-Cl035-MT103.endfb8.0
INFO:root:EVALUATION: Converting MeV to eV...
INFO:root:EVALUATION: Converting mb to b...
INFO:root:EVALUATION: Finished. ENDF data contains 8791 datapoints.
INFO:root:Extracting samples from dataframe.
INFO:root:EXFOR extracted DataFrame has shape: (215, 104)
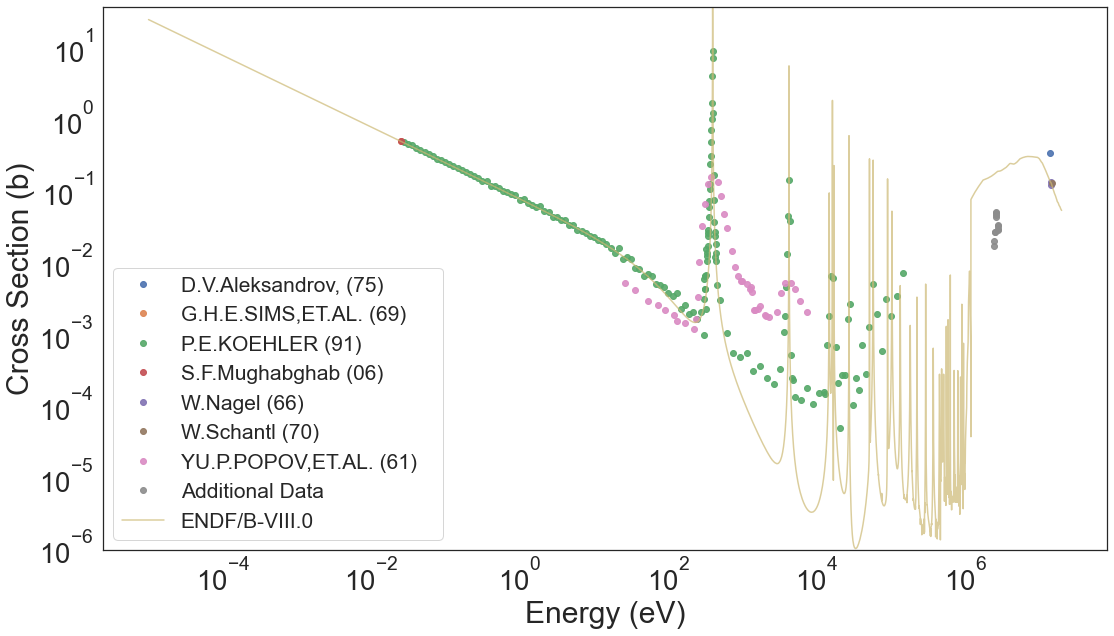
Notice how the new data is plotted and the legend “Additional Data” is given.
Plotting Evaluations and EXFOR Datapoints as Lines
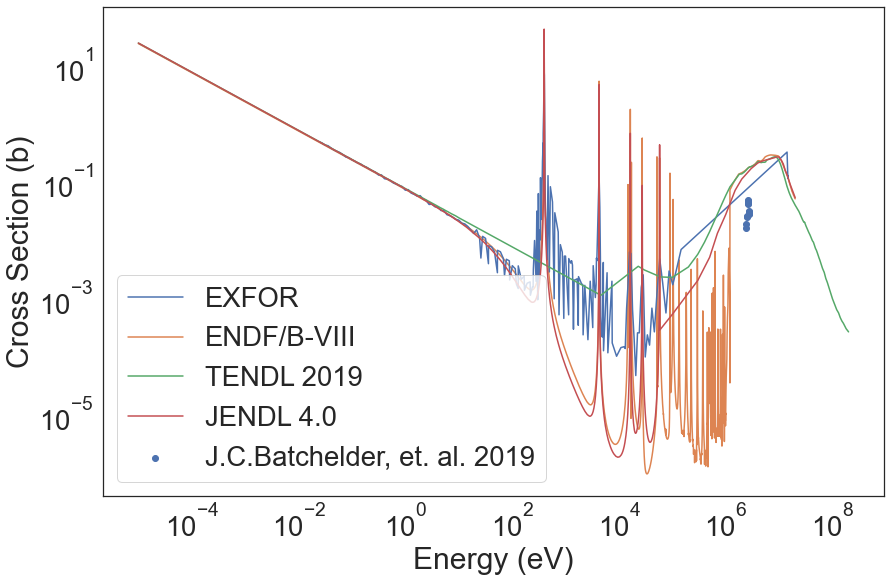
In the previous example, the ENDF line is plotted in combination with the EXFOR scatterplot. We can also plot the EXFOR datapoints as a line in combination with several other evaluations supported.
[21]:
# extract only chlorine data points
chlorine_35 = exfor_utils.load_samples(df, 17, 35, "103")
INFO:root:Extracting samples from dataframe.
INFO:root:EXFOR extracted DataFrame has shape: (215, 104)
[22]:
eval_plot.plot("Cl035", "103", exfor=chlorine_35.copy(), exclude=["jeff"],
               new_data=new_data, new_data_label="J.C.Batchelder, et. al. 2019",
               save=True, save_dir=figure_dir)
INFO:root:EVALUATION: Extracting data from C:/Users/Pedro/Desktop/ML_Nuclear_Data/Evaluated_Data\neutrons/Cl035/endfb8.0/tables/xs/n-Cl035-MT103.endfb8.0
INFO:root:EVALUATION: Converting MeV to eV...
INFO:root:EVALUATION: Converting mb to b...
INFO:root:EVALUATION: Finished. ENDF data contains 8791 datapoints.
INFO:root:EVALUATION: Extracting data from C:/Users/Pedro/Desktop/ML_Nuclear_Data/Evaluated_Data\neutrons/Cl035/tendl.2019/tables/xs/n-Cl035-MT103.tendl.2019
INFO:root:EVALUATION: Converting MeV to eV...
INFO:root:EVALUATION: Converting mb to b...
INFO:root:EVALUATION: Finished. ENDF data contains 592 datapoints.
INFO:root:EVALUATION: Extracting data from C:/Users/Pedro/Desktop/ML_Nuclear_Data/Evaluated_Data\neutrons/Cl035/jendl4.0/tables/xs/n-Cl035-MT103.jendl4.0
INFO:root:EVALUATION: Converting MeV to eV...
INFO:root:EVALUATION: Converting mb to b...
INFO:root:EVALUATION: Finished. ENDF data contains 2130 datapoints.
INFO:root:EVALUATION: Extracting data from C:/Users/Pedro/Desktop/ML_Nuclear_Data/Evaluated_Data\neutrons/Cl035/jeff3.3/tables/xs/n-Cl035-MT103.jeff3.3
INFO:root:EVALUATION: Converting MeV to eV...
INFO:root:EVALUATION: Converting mb to b...
INFO:root:EVALUATION: Finished. ENDF data contains 501 datapoints.
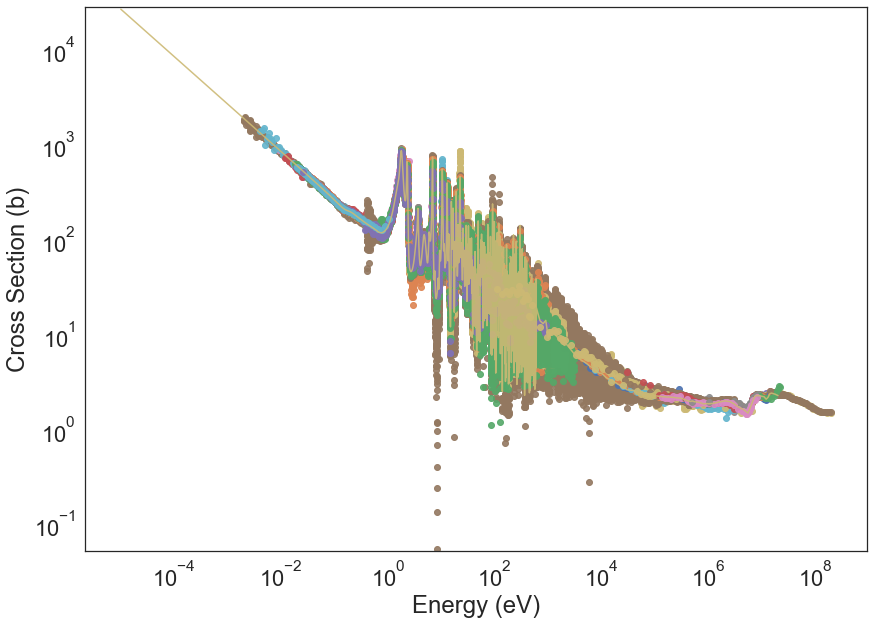
More Visualization Examples
[19]:
kwargs = {"nat_iso":"I", "one_hot":False, "alpha":0.9, "legend":False, "interpolate":False,
          "log_plot":True, "ref":True}

u_exfor_endf = exfor_utils.plot_exfor_w_references(df, 92, 233, "18",
                                                   get_endf=True,
                                                   error=True,
                                                   save=True,
                                                   path=figure_dir,
                                                   **kwargs)
INFO:root:EVALUATION: Extracting data from C:/Users/Pedro/Desktop/ML_Nuclear_Data/Evaluated_Data\neutrons/U233/endfb8.0/tables/xs/n-U233-MT018.endfb8.0
INFO:root:EVALUATION: Converting MeV to eV...
INFO:root:EVALUATION: Converting mb to b...
INFO:root:EVALUATION: Finished. ENDF data contains 15345 datapoints.
INFO:root:Extracting samples from dataframe.
INFO:root:EXFOR extracted DataFrame has shape: (94661, 104)
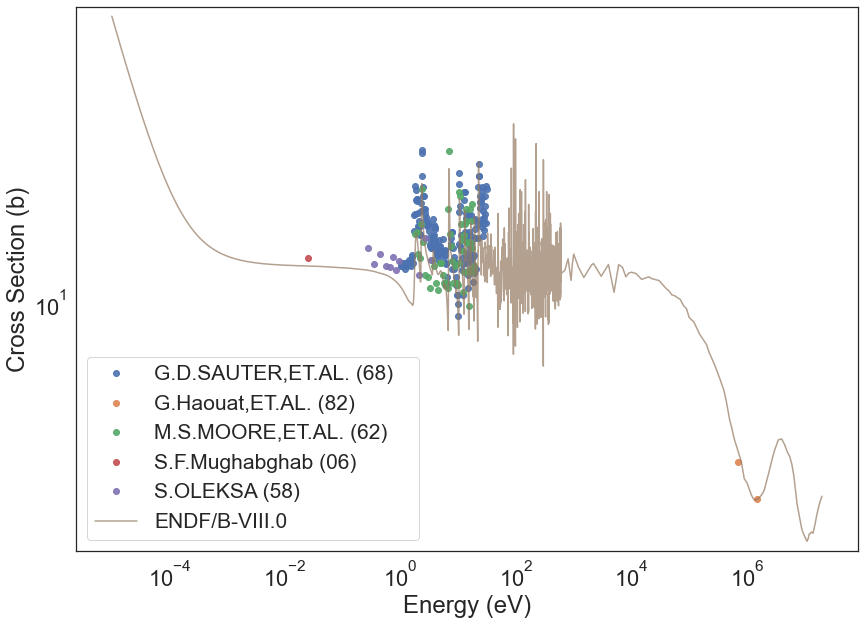
[20]:
kwargs = {"nat_iso":"I", "one_hot":False, "alpha":0.7, "legend":True, "interpolate":False,
          "log_plot":True, "ref":True}

u_exfor_endf = exfor_utils.plot_exfor_w_references(df, 92, 233, "2",
                                                   get_endf=True,
                                                   error=True,
                                                   save=True,
                                                   path=figure_dir,
                                                   **kwargs)
INFO:root:EVALUATION: Extracting data from C:/Users/Pedro/Desktop/ML_Nuclear_Data/Evaluated_Data\neutrons/U233/endfb8.0/tables/xs/n-U233-MT002.endfb8.0
INFO:root:EVALUATION: Converting MeV to eV...
INFO:root:EVALUATION: Converting mb to b...
INFO:root:EVALUATION: Finished. ENDF data contains 5590 datapoints.
INFO:root:Extracting samples from dataframe.
INFO:root:EXFOR extracted DataFrame has shape: (261, 104)
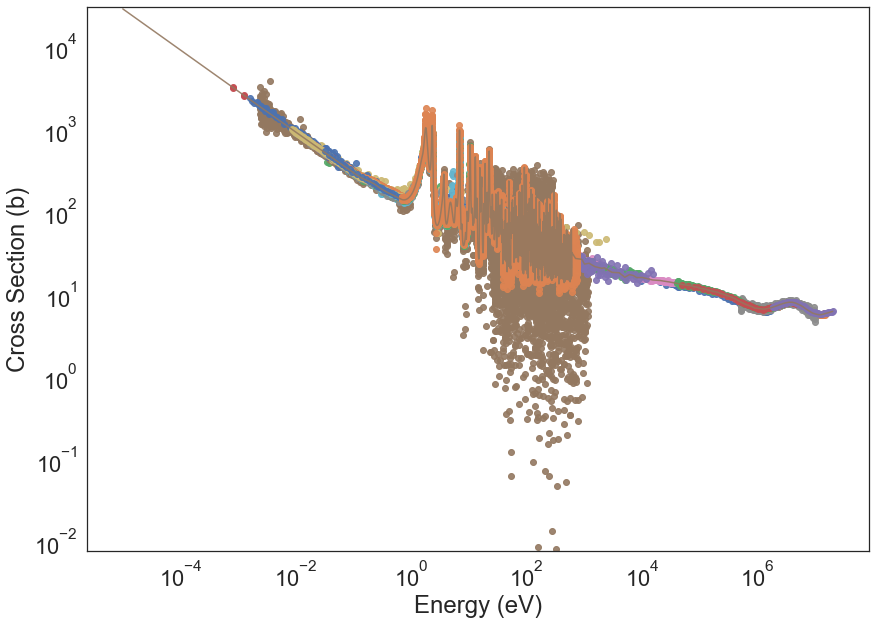
[30]:
kwargs = {"nat_iso":"I", "one_hot":False, "alpha":0.9, "legend":False, "interpolate":False,
          "log_plot":True, "ref":True}

u_exfor_endf = exfor_utils.plot_exfor_w_references(df, 92, 233, "1",
                                                   get_endf=True,
                                                   error=True,
                                                   save=True,
                                                   path=figure_dir,
                                                   **kwargs)
INFO:root:EVALUATION: Extracting data from C:\Users\Pedro\Desktop\ML_Nuclear_Data\Evaluated_Data\neutrons/U233/endfb8.0/tables/xs/n-U233-MT001.endfb8.0
INFO:root:EVALUATION: Converting MeV to eV...
INFO:root:EVALUATION: Converting mb to b...
INFO:root:EVALUATION: Finished. ENDF data contains 12617 datapoints.
INFO:root:Extracting samples from dataframe.
INFO:root:EXFOR extracted DataFrame has shape: (33385, 104)
[31]:
kwargs = {"nat_iso":"I", "one_hot":False, "alpha":0.7, "legend":True, "interpolate":False,
          "log_plot":True, "ref":True}

u_exfor_endf = exfor_utils.plot_exfor_w_references(df, 92, 233, "102",
                                                   get_endf=True,
                                                   legend_size=15,
                                                   error=True,
                                                   save=True,
                                                   path=figure_dir,
                                                   **kwargs)
INFO:root:EVALUATION: Extracting data from C:\Users\Pedro\Desktop\ML_Nuclear_Data\Evaluated_Data\neutrons/U233/endfb8.0/tables/xs/n-U233-MT102.endfb8.0
INFO:root:EVALUATION: Converting MeV to eV...
INFO:root:EVALUATION: Converting mb to b...
INFO:root:EVALUATION: Finished. ENDF data contains 19513 datapoints.
INFO:root:Extracting samples from dataframe.
INFO:root:EXFOR extracted DataFrame has shape: (4588, 104)
